
St Louis Market Trends
Newest St. Louis Housing Report
These figures compare real estate activity in August 2025 to August 2024
The St. Louis August 2025 housing report reveals that the market is cooling but remains competitive, with home prices up and inventory constraints easing slightly.
Market Highlights
-
Home sales down: Closed sales of residential homes in August dropped 4.9% compared to last year, and year-to-date sales are also down 2.9%.
-
Listings slipping: New listings fell by 1.3% for single-family homes and by 8.1% for condos/townhomes over the past year.
- Prices still rising: Median sale prices for residential homes increased 3.2% to $320,000, while condo prices grew 1.9% to $219,000.
Homes taking longer to sell: The average days on market increased to 32 for single-family homes—up 28% year-over-year—and to 40 for condos. - Buyers getting a slight edge: The percent of list price received nudged down to 100.6% for homes and 97.8% for condos, indicating slightly more room for negotiation than last year.
Inventory & Supply
-
Inventory improving for condos: Active condo/townhome listings jumped 15.5%, while inventory of single-family homes fell 9.1% compared to last year.
-
Months supply stable or growing: Months supply of homes dipped 8% to 2.3 months, staying in “seller’s market” territory, but supply for condos rose 13.8% to 3.3 months.
Affordability & National Context
-
Affordability is dropping: The Housing Affordability Index for the region fell 4.6% for homes and 3.9% for condos, reflecting higher prices and interest rates squeezing buyers.
-
National trends: Nationally, inventory is at its highest since May 2020, helping slow price growth, with the U.S. median existing-home price only up 0.2% year-over-year to $422,400.
Key Takeaway
The St. Louis market is balancing out: homes cost more and take longer to sell, but buyers have a bit more negotiating power. While it’s still a competitive landscape—especially for single-family homes—growing condo inventory may offer more options for those searching this fall.
Basic Real Estate Principles for All Markets
In real estate, the term "months of inventory" refers to the amount of time it would take to sell all the current listings on the market, assuming no new listings are added. This metric is calculated by dividing the total number of homes for sale by the number of homes sold in a given period, typically a month.
For example, if there are 3,000 homes listed for sale and 1,000 homes sold in a month, the months of inventory would be 3 months. Everything comes down to supply and demand. The graph below shows what you need to know (regardless where you live) because this applies to the real estate market everywhere. This is what drives prices up or down and shows you what type of market your area is experiencing.
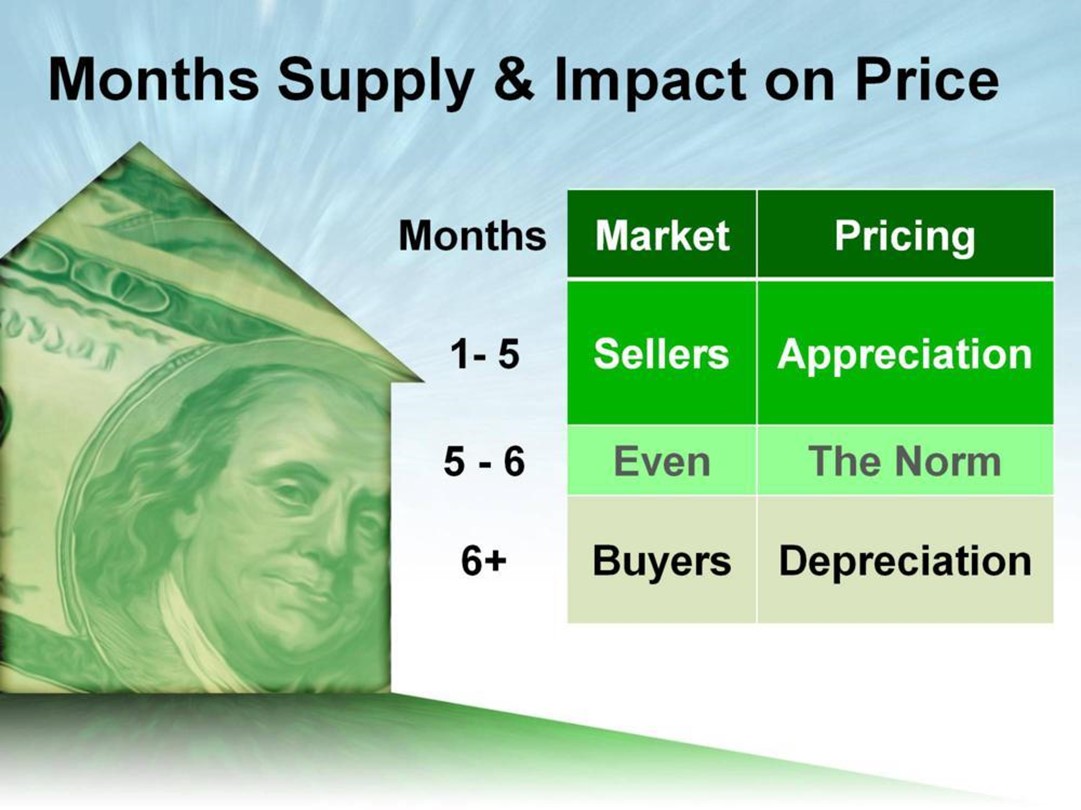
Below is the months of supply charts for St. Louis and St. Charles County
St Louis County Supply = 1.78 Months
St. Charles County Supply = 2.83 Months
Whether you're interested in the St. Louis or St. Charles area, the supply of homes is still low.
That's why home prices keep going up and why competition is still very much in the picture.
Attention Data Geeks and Chart Lovers Keep Scrolling for More
The charts below will show you month by month over the past 3 years how many new listings came on the market on a monthly basis.
If you put your mouse over the graph lines you will see the actual numbers and how they change month to month. This data is refreshed continuously so mark this page and come back in the future to see the trends.
St. Louis County New Listings
St. Charles County New Listings
St. Louis City Median Sales Price 3 Bedroom Home 5 Year Period
The charts below are interactive. As you move your cursor (or finger on mobile devices)on the chart line you'll see the median price for each month going
back to 2016.
St. Louis City Median Days on Market 5 Year Period
St. Louis County Median Sales Price 3 Bedroom Home 5 Year Period
St. Louis County Median Days on Market 5 Year Period
St. Charles County Median Sales Price 3 Bedroom Home 5 Year Period
St. Charles County Median Days on Market 5 Year Period
Links to More Communities for Median Prices 5 Year Period
Ballwin
Chesterfield
Wildwood
Brentwood
Maplewood
University City
Ladue
Kirkwood
Central West End
Finding Homes for You Leads with Data
How can you know the trends and the pulse of any market without timely data? You can't. If you would like to know more about a particular market we can provide you with so much more. To get started just tell us the basic items you need as outlined in the image below:
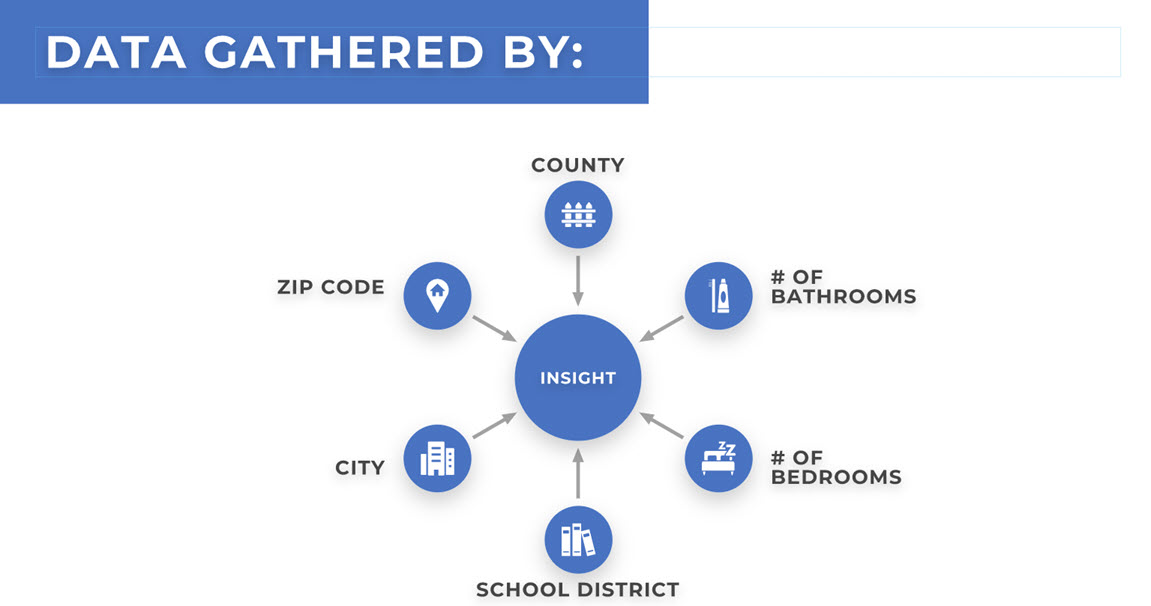
We Will Send You These Reports
Median Sales Price
Days on Market
Percentage the Sellers are Getting for Home
Just put your question or comment in the form below and we will email you the information
Example: "Looking for 4 bedroom home with 2+ bathrooms in Parkway School District"